Monday, August 31, 2009

'1 CT Spyder' generated a long entry signal for tonight's close (8/31/2009)


'1 CT Spyder' generated a long entry signal for tonight's close (8/31/2009).

The model was rebuilt as of today. The overall logic has remained the same. The parameter setting for the primary filter and for the dynamic stop size were tweaked just a little bit.

The model's equity curve flat lined from the beginning of 2006 through the beginning of 2008. In April of 2008 the model broke out to the upside followed by two additional trades and two additional equity curve highs.

Here are some of the model's Performance Statistics:
  • Model Tracking Vehicle=SPY
  • Start Date=2/2/1993
  • Number of Trades=46
  • Average Trade Return=0.63%
  • Average Winning Trade Return=1.18%
  • Average Losing Trade Return=-0.92%
  • Win Rate=74%
  • Ratio of Average Win/Average Loss (RAWAL)=1.29
  • Profit Factor=3.65
The performance of this model is rather strong with a RAWAL of 1.29 and 74% winners. The dynamic stop is rather large though, currently at about 2.50%. The stop has been triggered during 2 of the 46 trades (4% of the time). If the stop is not hit intraday tomorrow, then the trade is due to be exited at the close on Tuesday.

Disclosure: Long ESU09.

Disclosure: The performance results shown above are for Model analysis purposes and do not include commission or slippage. The model is built on data from the SPY, but I trade the model with the ES e-mini. Actual trading results from the ES usually differ from the model results of the SPY, with the ES showing somewhat weaker performance data. Nonetheless, I still trade this model with the ES and when executed according to the plan, it has generated consistent profitability for me.

***remember this is an illustration of what i am trading and my thinking...my trading plan may change without notice...this is not a recommendation for you or anyone else, to buy or sell this or any other security...***

8/31/2009 post close update


  • for the NQ Discretionary swing trade, i added 1 contract sunday night at 1638.50, and another contract around 10am this morning at 1620.25...
  • currently long 2 NQU09 at avg 1629.38...
  • for the overnight session and for tuesday's day session i am looking to sell the first lot at limit 1635.00 and the second lot at limit 1646.00...these levels may change though at any time...
  • rebuilt the '1 CT Spyder' model, which also happened to generate a long entry signal for today's close...
Disclosure: Long NQU09.

***remember this is an illustration of what i am trading and my thinking...my trading plan may change without notice...this is not a recommendation for you or anyone else, to buy or sell this or any other security...***

Friday, August 28, 2009

8/28/2009 post close update


  • wow, lots of swings...just had to let it go at 1645.00 for +6.50 points...
  • currently flat the NQ...
  • looking to re-enter at 1640.50 for the rest of the session...if not filled i will place an entry order for the sunday night session, but i am not sure for what limit price yet....
  • so that makes +27 points for the day (4 contracts at 6.75 points per), and about 37 points for the week...
  • no systemic swing trade entries for today or any day this week...i am expecting to get some entries soon as they tend to have periods of no activity and then periods of high activity...hopefully i will start to see some positive performance from them soon...

"...just when i thought i was out, they pull me back in..." -- michael corleone

  • filled at 3:47 pm: long 1 contract at 1638.50....
  • will sell it during the day session at limit 1646.50...if not filled, will hold it over the weekend...

Disclosure: Long NQU09.

***remember this is an illustration of what i am trading and my thinking...my trading plan may change without notice...this is not a recommendation for you or anyone else, to buy or sell this or any other security...***

8/28/2009 330 pm update


  • maybe i was getting a bit cute thinking that we could run up above the 1648 pivot and the 1650 whole number...ATR Volatility chart has the green sell line at 1648...the upper 1640's seems to me like the better sell area...
  • getting a bit tired and hungry as well...
  • afraid of not booking some profit on this last contract? perhaps...
  • not sure which of the above, the technicals or my physical/emotional state, was the most influential in my thinking...
  • all of this led to me selling the last NQ at 1647.25 at 324pm for +5.25/contract...
  • currently flat the NQ...
  • sold 3 contracts today at an average of 6.83 points/contract for a net total of +20.50 NQ points...best day of the week...netted about 30 NQ points total for the week...i have been targeting 10 points/day, 50 points/week...not sure how realistic this is with my current style of NQ discretionary trading in this current environment...this target appears to be very aggressive...i need to look through my performance data to see what level of daily and weekly targets might be more appropriate...
  • looking to re-enter during the day session at 1638.50: 1) just above the dark green buy line on the ATR Volatility chart; 2) just above the flat 20ma on the 60M chart (not shown)...

8/28/2009 3 pm update


  • NQ much weaker than i anticipated...the gap up was sold hard...
  • a few minutes after today's open, it crossed my mind to possibly short the large gap up (my long was already sold at 1646 so i was flat...), but i was still leaning to the bullish side short term...one of the things i need to work on is learning how to trade to the downside when i feel the NQ is short term overbought, even though i believe i should be bullish on the longer time frame...
  • volatility increasing....yesterday's ATR volatility (2.01%) was greater than its average ATR volatility (1.57%)...today's volatility (2.32%) is even greater than yesterday's....not sure what if any kind of predicitive value this may have for trading over the next few days, but it appears to me that the bulls and the bears have stepped up their activitites...
  • when the NQ sold off to the low 1630's around 1230 pm, i purchased a second contract at 1632.75, lowering my average cost to 1642.00...
  • i selected the low 1630's because: 1) it is just above the 1628 pivot that has been in effect since friday 8/21; 2) above the rising 200ma (magenta line) on the 15M chart...the ATR volatility chart did not play into it...
  • SMH has broken above the top of its base at 25.50ish that dates back to the end of july...but after the opening gap up, it has sold off to the breakout area and has been flatlining since late morning...INTC, which is leading the SMH shows the same pattern...
  • TRINQ still very bullish, but the NASDAQ A/D line is very weak...
  • i am begining to feel a bit more bearish on the NQ shorter term, so instead of carrying the two contracts to sell at higher levels over the next few days, i used the pop above 1640 to the flat 20ma on the 15M to exit...sold 1 contract at 1642.00 for 0 pts/contract...
  • though i did not make any money on this sale, i did reduce my exposure and free up some liquidity for further additions if we head lower...
  • i am currently looking to sell the remaining contract at limit 1652.50 for the day session...if the NQ is above 1647.50 around 4pm and if i am stil long, i will sell it at limit 1647.50, and then look to buy this lot back at a lower level during the sunday night sesssion...if the NQ sells off, then i will hold the lot over the weekend...
  • still looking to buy another contract at 1603.50...this order will hang around for a few days...
  • i am looking for continued sideways and perhaps upside action through tuesday sep 1..after that i will reassess my short term bias, and my subsequent NQ discretionary swing trading plan....
  • rebuilt the 'IDX OU' systemic swing trading model...
  • currently working on rebuilding the '1 CT Spyder' model...
Disclosure: Long NQU09.


***remember this is an illustration of what i am trading and my thinking...my trading plan may change without notice...this is not a recommendation for you or anyone else, to buy or sell this or any other security...***

8/28/2009 10 am update


  • back in long NQ at 1651.25 at 10:01 am...i might have gotten a better price if i waited for more of a gap fill to the 1645 area into the 1030 time frame, but i got a bit nervous that the NQ wouldn't get there...
  • looking to sell this lot at limit 1665.00...the ATR Volatility Band indicator is saying that today's ATR Volatility of 1.78% (yellow vertical histogram bar) is just above the average ATR Volatility of 1.62% (horizontal red line in the sub graph of the bottom chart) for the past 8 days...i take this reading to mean that there is a good chance that the high for the morning has been set at 1668.50...the ATR Volatility Band's lower red sell line is at 1670, and the high of the morning is at 1668.50...both of these values were very influential in me currently setting my exit order at limit 1665.00...


Disclosure: Long NQU09.

***remember this is an illustration of what i am trading and my thinking...my trading plan may change without notice...this is not a recommendation for you or anyone else, to buy or sell this or any other security...***

the hunt is on


  • in my view, right now the NQ is too far extended above its uptrending 8ma (red line) and its uptrending 20 ma (beige line) on the 15M chart to enter long in the mid to upper 1650's...looking for NQ to correct some more in both price and time...
  • currently considering re-entering in the high 1640's - low 1650's during the 10-1030 time frame....this price level is also at a previous pivot...
  • TRINQ very strong, but the NASDAQ A/D line is just above flat, so mixed readings from the market internals...
  • watching, waiting...the hunt is on...

8/28/2009 pre market update


  • sold my NQU09 in the overnight session at 1646.00 for +15.25 points/contract...
  • shortly after the sale, INTC raised their revenue guidance and the NQ popped to the 1660 area...
  • unlike the major indices and the XLF, the SMH has not broken out of its recent base...watching it and INTC to see how they deal with testing the high of their current bases...
  • for 6 straight trading days (since thursday 8/20), the NQ high or low of the day has been set between 10-1030 in the morning...
  • i am watching this NQ gap up carefully...
  • not sure if and where i would get back in to establish a new long position in the NQ...if i do get back in today, it would be on a pullback...

Thursday, August 27, 2009

8/27/2009 1 pm update


  • the order to sell NQU09 limit 1626.50 was filled at 1626.50 for a 4.25 point loss/contract from the average price of 1630.75/contract...
  • for my current discretionary swing trading style, i am experimenting with not using firm stops, but rather weighing my current exposure against my shorter and longer term views...longer term, i am very bullish on the NQ...shorter term, there are some signs of topping action and we are heading into the september/october period which can be very volatile...so with this set of short and long term views, i still want to have some long side exposure, but not as much if i thought that on both a short and long term basis the NQ would head higher...i will attempt to work my average price down during selloff's and then look to add more exposure if i believe the NQ is ready to reverse back up and make new swing highs...prior to today, i was long 1 contract at 1644, now i am long 1 contract at 1630.75...this 13.25 point difference only cost me 4.25 points because of the way that i worked my second entry and its subsequent exit...
  • the 1626.50 sell level was selected because: 1) it is just below the 1628 pivot that had been support for the past 4 days and is now resistance; 2) just below the declining 20 ma on the 15M chart; 3) a bit below the lower red sell line on the ATR Volatiltiy Band chart...
  • as the NQ began to move from the low 1620's to the mid 1620's i did start to feel some anxiety that my limit order was a bit too high and wouldn't fill...i thought to myself that i should let the order sit and if the order did not fill within a reasonable period of time, then i would lower it a bit...the order did fill within that reasonable period of time...
  • i am proud of myself: even though i felt some anxiety, i did not immediately change my order, but rather i came up with a plan if the order did not fill in a reasonable period of time...
  • i did lower the second exit order from limit 1646.50 to 1646.00...
  • i am currently long 1 contract at 1630.75 (theoretical)...
  • i do want to add a second lot, but at what price? i will add if the NQ sells of some more, at limit 1603.50...
  • this 1603.50 level is derived from the following: 1) just above the whole number 1600; 2) just above above the 1600 pivot from 8/19/2009; 3) just above the rising 200 ma on the 60M chart (not shown); 4) just above the lower buy band (dark green line) on the ATR Volatility chart...
  • but what if the NQ continues to rally? then, i will wait to see how the charts setup...this waiting and not knowing is a bit new for me...i need to listen to what the NQ is telling me...right now, as far as i am concerned, the NQ is not saying a thing to me about where to add if the strength continues through lunch and into the afternoon...i will be watching and waiting...
  • in the mean time, i will be rebuilding the 'SB IDX' systemic swing model...
Disclosure: Long NQU09.

***remember this is an illustration of what i am trading and my thinking...my trading plan may change without notice...this is not a recommendation for you or anyone else, to buy or sell this or any other security...***

8/27/2009 1115 am update


  • NQU09 breaking below the bottom of the recent 4 day base...
  • in hindsight, my 1644.00 entry is not looking so good...perhaps i should have worked my price down a bit, but my bias was still to favor the long side...
  • the limit 1617.50 order was filled, current avg entry price of 1630.75...
  • the 1617.50 entry level was determined by: 1) just above the 1615.00 pivot of 8/20/2009; 2) just above the rising 200 ma on the 15M chart; and 3) right at today's upper buy band (green line) on the ATR Volatiliy Band chart...
  • ATR Volatility has picked up a bit from the past few days...
  • looking to sell one lot at limit 1626.50 for this day session, and to sell the second lot at 1646.50 for this day session...
  • if these orders do not fill, i will hold this position overnight...
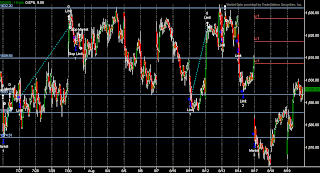
  • i would love to plot the ATR Volatility Band indicator (second chart) on the my main 15M chart (first chart), but there would be too many lines and thus make the 15M chart too hard to read...
Disclosure: Long NQU09.

***remember this is an illustration of what i am trading and my thinking...my trading plan may change without notice...this is not a recommendation for you or anyone else, to buy or sell this or any other security...***

Wednesday, August 26, 2009

8/26/2009 1015 am update


  • NQ finally showing some rs compared to other major market indices...SMH leading...
  • currently long from yesterday at 1644.00...
  • selling limit 1652.00...if filled looking to get long again at limit 1637.50...
  • looking to get long a second lot at 1617.50...
  • really digging my ATR Volatility Bands indicator...
  • heading out for a few hours...
Disclosure: Long NQU09.


***remember this is an illustration of what i am trading and my thinking...my trading plan may change without notice...this is not a recommendation for you or anyone else, to buy or sell this or any other security...***

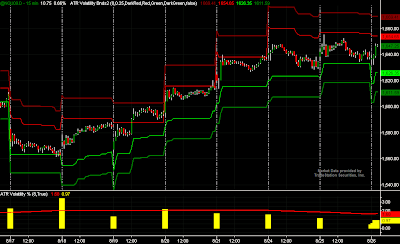
ATR (Average True Range) Volality Bands for Intraday trading: version 2

  • here is a 15M chart of the NQU09.D from around 1130 am this morning...
  • using an ATR calculation, i want to try to predict where the probable intraday high and low ranges will be for the NQ...
  • the subchart displays the ATR volatility in percent terms...the yellow vertical bar histogram shows how volatile each intraday session is....currently the difference between the true high and the true low for the current daily bar in the NQ is 1.31% of the last trade in the NQ....the red horizontal line is an 8 period moving average of the daily ATR volatility...it is currently at 1.84%
  • so far for today, the NQ is less volatile than its 8 day average volatility...
  • i use the average ATR volatility to help determine where the ultimate high and the ultimate low for the current daily bar might be...there is no guarantee the NQ will trade to these levels, however if the NQ has a typical day, then attempting to project these high and low range areas may have some relevance...
  • however, i believe it would not be useful to attempt to predict the exact high and the exact low, so i have opted to try to predict a high range and a low range...
  • the calculations for the high range are relatively straight forward: in order to project the high, i use the known true low and then add the current average ATR...this gives me a firm projected high...however, i don't want a firm projected high, but rather a projected high range, so i tweak the firm projected high with a user defined 'band variance factor'...the 'band variance factor' replaces the projected firm high with two new highs, one above the firm high and the other below the firm high...the size of the expansion is dictated by the size of the 'band variance factor'...these two highs are then plotted on the chart of the NQ...
  • the dark red band represents the upper portion of the projected high range...the red band represents the lower portion of the projected high range...
  • the calculations for the low range are relatively straight forward: in order to project the low, i use the known true high and then subtract the current average ATR...this gives me a firm projected low...however, i don't want a firm projected low, but rather a projected low range, so i tweak the firm projected low with a user defined 'band variance factor'...the 'band variance factor' replaces the projected firm low with two new lows, one above the firm low and the other below the firm low...like mentioned above, the size of the expansion is dictated by the size of the 'band variance factor'...these two lows are then plotted on the upper chart of the NQ...
  • the dark green band represents the lower portion of the projected low range...the green band represents the higher portion of the projected low range...
  • i specifically used the dark red, red, green and dark green colors...if my bias was to be long, i would look to buy some near the green line, and buy some more near the dark red line....then i would look to sell some near the red line and sell some more near the dark red line...if my bias was short, then i would look to short some near the red line, and short some more near the dark red line...then i would look to cover some near the green line and then cover some more near the dark green line....
  • if long and the vehicle traded below the dark green line, then perhaps a stop loss would be in order...if short and the vehicle traded above the dark red line, then perhaps a stop loss would be in order...
  • however, this would not be my only analysis tool for determining optimal entries, exits and stops...i would also be using multiple time frame analysis, moving averages and pivots...these projected intraday highs and lows would be another analysis tool to help me optimize my entries, exits and stops...
  • the 'band variance factor' is user defined and easily changed...
  • i am excited to have added this tool to my trading toolkit...
  • currently i am using this indicator for the NQ but it can be used for any symbol...
  • if you are interested in taking this indicator out for test run and you use tradestation, then let me know and i will send it over to you free of charge...
  • if anyone has any ideas on how to improve this indicator, especially on how to optimize the 'band variance factor' such that it creates true high ranges and true low ranges that get pierced a significantly high amount of the time that then lead to reversals, then please let me know...

Tuesday, August 25, 2009

back in sync: is fear now my friend?


  • when the NQ started to retest the morning highs, i tweaked the exit and got filled at 1651.75 (+9.25 points/contract)...
  • i was looking to buy this lot back at limit 1643.50...tweaked the entry and got filled at 1644.00...
  • both of these tweaks were based on fear: fearful that my exit at 1653.50 wouldn't fill and then fearful that my entry at 1643.50 wouldn't get filled...as it turned out 1653.50 would not have filled, and i would have been pissed to watch the NQ fall back into the low 1640's...
  • 1643.50 may have filled, but since that was the low of the swing down from 1652.75, it may have not...
  • so fear definitely helped my exit and may have helped the following entry...my intention of trading with less of an influence by fear would have hurt me in these two instances...not looking to make any drastic changes regarding how fear influences my trades, just observing it...
  • currently looking to sell this newly added lot at limit 1662.50 during the day session...
  • currenlty looking to buy another lot during the day session at limit 1617.50...
Disclosure: Long NQU09.


***remember this is an illustration of what i am trading and my thinking...my trading plan may change without notice...this is not a recommendation for you or anyone else, to buy or sell this or any other security...***

8/25/2009 11 am update


  • ego, ego, ego!! so invested in the trades outcome...so pissed when i am out of sync!!
  • afraid of not having a position in the NQ for the discretionary swing trade...afraid that i am going to miss the move...afraid, afraid, afraid...
  • tired of the day and night sesssion chop in the NQ since mid morning friday...when the NQ gapped up this am into the low 1640's, my limit order which was moved down from 1656.50* to the mid 1640's, but i kept on missing the exit by a few ticks...so i moved the limit order down and down and down and the got filled at 1641.25 (for +5.75 NQ points/contract)...
  • what did the NQ do then?? why it went on to rally to recent resistance at 1647ish, break that resistance and rally up to 1655.50...
  • i decided that i did want to get back into the NQ, but at a level that takes the following into consideration: multiple time frame analysis (15M, 60M, Daily), pivots, moving averages and expected ATR high/low areas (http://stbsmb.blogspot.com/2009/08/atr-average-true-range-volality-bands.html)...this analysis led me to place a re-entry order at limit 1642.50...
  • the 1655.50 high of the day was hit at 1004 am, and then 14 minutes later i was filled at 1642.50...i didn't expect/want to get filled that quickly, as that quick reversal suggest potential weakness....however the market internals were either neutral (TRINQ) or bullish (AD LINE), so i still took the trade...
  • exit order at limit 1653.50...
  • in my vcm daytrading account, i shorted the COCO gap up...the entry was good, however i messed up the exit just like i did yesterday with VRX...
  • when R base trading, i need to decide if i am going to scalp a small portion of the position when the trading vehicle moves to predefined pivots and moving averages (for both exits and entries), or if i am going to use an AON (all or none) tactic with a hard stop and a hard target...i need to think more about this...
* i tend to place an entry and an exit order in the overnight session that is somewhat far away from the closing price, but within 1 ATR of the that closing price...i don't expect the order to be filled, but i want to take advantage of the possibility of a volatile overnight session and have an order sitting there just in case we have a big move in either/both direction(s)....the more heavily i am currently positioned the more inclined i am to exit than enter, and the more lightly i am positioned, the more inclined i am to enter than exit...

Disclosure: Long NQU09.


***remember this is an illustration of what i am trading and my thinking...my trading plan may change without notice...this is not a recommendation for you or anyone else, to buy or sell this or any other security...***

Two great blogs: Dr. Brett Steenbarger's 'Trader Feed' and Rob Hanna's 'Quantifiable Edges'.

I have been traveling through the blogosphere of late and have found numerous great sites, all of which have been added to the blog roll (to the right and the then scroll down a bit).

However two stand out to me:
  • Dr. Brett Steenbarger's TraderFeed ...in addition to numerous technical and statistical studies that are posted, he just hits the ball out of the park when it comes to the psychology, trading and peak performance...this is a great example: Mental Fatigue and getting to the next level of performance
  • Rob Hanna's Quantifiable Edges...on a daily basis, he performs original studies on market behavior...i have numerous ideas for potential systemic swing trading models based on the concepts and research that he has performed and documented...

Quantifiable Edges: Studies from Rob Hanna that I should do further modeling on

The following links are to studies that Rob Hanna posted on his Quantifiable Edges blog from 5/22/2008-8/24/2009 that I should do some further modeling on:

I will continue to review Rob's blog for additional market behavior research.

Monday, August 24, 2009

Ed Seykota + Essential Trading Rules + Bluegrass Music = 'The Whipsaw Song'

Ever since I read about Ed Seykota in Jack Schwager's 'Market Wizards' I have been a huge fan.

Here, he ups his game:


8/24/2009 post close update

NQU09 discretionary swing trade:

  • very narrow day for the NQU09 today...
  • still long 1 contract at 1635.50...
  • current orders to sell limit 1656.50 and to buy a second contract at limit 1617.50...
  • working on building an indicator that plots an average true range (ATR) projection for the High range and the Low range of the current trading day...in addition to the obvious pivot points on a 15 minute chart, i am incorporating these High and Low range projections into my thinking when determining buy and sell levels for the NQU09...
Systemic swing model rebuild:

  • the $IDX and the $RUT.X data series on TradeStation incorrectly reports the Daily Bar's opening price...it uses the previous Daily bar's Closing price, and thus there are no Opening gaps...this inaccurate data was effecting the entry filters and the stops for models that use these data series...a different data series is now being used as a proxy for the S&P 400 (MDY) and the Russell 2000 (IWM)...
  • the 'BO IDX' model was rebuilt on the MDY data series...it is being discontinued because it is not robust...this discontinuation saved me some money today as the old 'BO IDX' model generated an entry signal for this past friday's close which would have posted a 0.50% stop loss today...i am pretty psyched to have finally had a model rebuild that worked in my favor...
  • 'BTBT IDX' and 'BTBT RUT' have been successfully rebuilt using the new data series'...
  • there is a lot more testing/building to be done, but progress is being made...
VCM daytrading:

  • learning a trading style that gets my position bigger as it goes in my favor, as opposed to getting bigger when it goes out of my favor...very interested in continuing to learn more about this style...

Disclosure: Long NQU09.


***remember this is an illustration of what i am trading and my thinking...my trading plan may change without notice...this is not a recommendation for you or anyone else, to buy or sell this or any other security...***

Friday, August 21, 2009

8/21/2009 noon update


  • major indices holding the morning breakout...
  • financials and ES leading, semi's and NQ lagging...
  • even though the NQ's are lagging, they are my discretionary swing trading vehicle of choice...
  • went long NQU09 at 1635.50...
  • selling this lot today at limit 1647.50...if that price is not hit, then i will hold it over the weekend and reassess its target exit...
  • adding another lot at limit 1617.50...
  • at 1210pm i changed the next entry order from 1617.50 to 1623.50...
Disclosure: Long NQU09.
***remember this is an illustration of what i am trading and my thinking...my trading plan may change without notice...this is not a recommendation for you or anyone else, to buy or sell this or any other security...***

ECRI's WLI growth rate ratches up again

Economic Cycle Research Institute's news release: Though Analysts Clash, Firm U.S. Recovery at Hand


"...The index's annualized growth rate ticked up to 17.5 percent after hitting a 26-year high of 14.3 percent last week, which was also revised higher from 13.4 percent.

It was the highest yearly growth rate the index has seen since the week to July 29, 1983, when it was 17.8 percent.

"It is high time to break from the herd of pessimistic analysts, who will continue to bemoan economic weakness long after the Great Recession is history," said Lakshman Achuthan, Managing Director at ECRI.

Achuthan told Reuters last week that he expects the recovery to take hold at a stronger pace than any the U.S. has seen since the early 1980s..."

8/21/2009 11 am update

NQ discretionary swing trading:


  • bought some NQU09 during the overnight session at 1608.50 and sold it into the top of the pre-open range at 1622.75...
  • booked + 14.25 NQ points/contract...
  • NQ showing relative weakness (rw) compared to YM, ES, EMD, TF...
  • i missed getting back in during the post open sell off...NQU09 traded down to 1614.25 and my order was limit 1613.50...
  • market ramps up after the 10 am housing data...
  • semi's lagging (SMH)...
  • ES breaking above its recent range, and showing relative strength...
  • took NQ a while longer to trade above the top of the month long base (1632)...
  • all major indices looking a bit extended and trading to or just above the recent month long range...most indices already moving to the extremes of their expected daily range...of course they could beyond their expected range, but it makes sense to me that they may stall for a bit in the current areas...
  • option expiration makes things a bit tricky...
  • i am not buying the NQ breakout right now...i am bidding for it at limit 1622.50 though...
VCM daytrading:


  • if i am going to scalp opening gaps, then i need to have a fixed dollar loss amount, perhaps 1 R unit...
  • today's opening gap up in CSTR that i traded to the long side, did nothing but sell off from the opening tick...
  • instead of limiting to my risk to 1 R unit, i just thought i could work the position back to break even...
  • after CSTR dropped below the breakout level (32.40 ish) and then below the whole number 32.00 i sold my position...this cost me 5 R's....way to much...
  • if i am going to scalp a position, it has to be with a max stop of 1 R...if i don't do this, the numerous small gains are going to be negated by the periodic large loss, like today and like numerous times in the past....
  • good lecture this am by oliver...discussion on opening gaps and on optimal self-talk...this morning, i did not follow his opening gap concepts...i got crushed...hmmmm, maybe i should be paying more attention to what he is talking about!
FAS longer term discretionary swing trade:
  • the IRA lot i bought on 8/11 at 66.65 i sold this am into resistance at 75.07...
  • two IRA lots to be purchased at limit: 68.35, 61.50...
  • the current two IRA lots to be sold at limit: 84, 94
  • 6 more custodial account lots to be sold at limit: 86, 88, 96, 98, 106, 108...
Disclosure: Long FAS.
***remember this is an illustration of what i am trading and my thinking...my trading plan may change without notice...this is not a recommendation for you or anyone else, to buy or sell this or any other security...***

Thursday, August 20, 2009

'BTD Index' generated an Exit Signal for Today's Close, 8/20/2009: books +51.75 NQ points/contract in 3 days.


  • 'BTD Index' generated an Exit Signal for todays close...this trade is different than the discretionary NQ swing trade discussed in the previous post...
  • the Modeled position (NDX) posted a 3.11% gain, with the actual Trading position (NQU09) posting a 3.28% gain (including commissions), slightly better than the model....
  • the 3.11% modeled gain is slightly better than the 2.71% average gain for profitable trades for the model...
  • this profitable trade created another new high for this model's Equity Curve...the position was held for 3 trading days.
  • on june 15 this model generated its first entry signal since december 2007...the current exit represents the 3rd trade for this model since the june entry...all have been winners...the holding period has decreased with each trade (8 days, 4 days, 3 days), suggesting that recent snapbacks after each entry have been getting quicker...don't know if this observation has any predictive value...
  • the concept of buying short term dips during longer term uptrends in the NDX continues to be robust...
  • the key to maximizing the profit potential from this concept is to strictly define the following: shorter term dip, longer term uptrend, price target exit, max holding period...

8/20/2009 post close update


  • exited all NQU09 discretionary swing trading lots today: 1 @ 1607.50, 1 @ 1612.50, 1 @ 1617.50, for an average exit of 1612.50...
  • this nets to +16.33 NQ points/contract with a holding period of 5 days...
  • currently flat, looking to re-enter with 1 lot at limit 1607.50...
  • todays daily range in the NQ was a bit narrower than i expected...
  • great phone conversation with JE today...
  • only made the time to rebuild one systemic swing trade model...
  • no systemic swing trade entries were generated for today's close...
  • happy to have finally booked some profits after the latest systemic swing trade stop loss...
  • happy with my vcm daytrading process and results...

8/20/2009 post open update

NQU09 discretionary swing trade/'BTD Index' systemic swing model:

  • NQU09 traded down to 1591 after the 830 economic data releases, and if that is the low for the session, and with an expected range of 2.00-2.60% today, then the NQU09 projects up to 1623-1632 for today's session...
  • 1632 has been the high of this month long base...
  • sell limit 1612.50 has been filled...
  • sell limit 1617.50 is still open...
  • though the 'BTD Index' systemic swing trading plan calls for exiting at the close if the NDX closes about 1603.50, i am going to call an audible and sell that NQU09 lot at limit 1622.50...this is against that model's trading plan...
  • added a buy limit 1603.50...if it fills, then i will sell it at limit 1622.50 and move the 'BTD Index' related lot from limit 1622.50 to 1627.50....
  • NQ started to show some RS compared to the other major equity indices (YM, ES, EMD, TF)...
VCM daytrading account:
  • shorted the LANC gap up into resistance and booked a quick + $0.70/share on the post gap up drop...
  • HURN gapped up, i bought some on a pullback, it didn't show much strength after the pullback, so i exited with + $0.06/share...
  • GENZ trading above its daily and hourly base, bought some on a pullback, exited on a return to the morning high for + $0.27/share...able to enter and exit a second position in GENZ for + $0.15/share...

Other:

  • really impressed with Dr. Brett Steenbarger's TraderFeed blog...i am finding it to be a great resource for statistical analysis of market behavior as well as for insights into the psychological (EQ) part of trading...
  • i am having a lot of fun trading today!
Disclosure: Long NQU09, Long GENZ.


***remember this is an illustration of what i am trading and my thinking...my trading plan may change without notice...this is not a recommendation for you or anyone else, to buy or sell this or any other security...***

8/20/2009 8 am


  • NQU09 traded up to 1607.75 and the sell limit 1607.50 exit order was hit...
  • i am concerned that during this rally off the lows of this past monday, the NQ has shown consistent relative weakness compared to the ES, EMD, TF and even the YM...
  • this concern and this new found sense of fear that the rally is going to peter out, has me lowering the sell limit 1627.50 order to sell limit 1612.50...
  • in addition to the sell limit 1612.50 order there is also a sell limit 1617.50 on the books...
  • 'BTD Index' is still open (http://stbsmb.blogspot.com/2009/08/btd-index-generated-entry-signal-for.html), and a close today in the NDX above about 1603.50 will have me exiting the 'BTD NDX' (traded with a different NQU09 lot) at today's close...
  • not sure how appropriate my fear response is right now...in any case, i am acting on it to some degree...i need to pay attention to the fear and how it has influenced my plan...
Disclosure: Long NQU09.

***remember this is an illustration of what i am trading and my thinking...my trading plan may change without notice...this is not a recommendation for you or anyone else, to buy or sell this or any other security...***

8/20/2009 2 am


  • NQ taunting me, banging its head at 1607.00 and my order 2 ticks above at 1607.50!
  • just joking...feeling very patient....letting the trade play out...
Disclosure: Long NQU09.

***remember this is an illustration of what i am trading and my thinking...my trading plan may change without notice...this is not a recommendation for you or anyone else, to buy or sell this or any other security...***
Wednesday, August 19, 2009

Upside projection for the NQU09 for Thursday 8/20/09: I am a seller into strength.


  • if today's upward momentum in the major equity indices can be at least maintained and perhaps continued in the coming asian and european sessions;
  • and if the NQU09 puts in a reasonably expected daily trading range of 2.00 - 2.60%, with the low of the session being maintained at say 1595;
  • then the NQ projects to trade up to the 1627 - 1636 area by the end of the thursday session...
  • resistance during the current 21 trading day range has been in the low 1630's...
  • current discretionary swing sell orders for the NQU09 are limit: 1607.50, 1617.50, 1627.50
  • its 1130 pm ny time, china is up 1.5% and japan is up 0.75%...
  • the NQU09 just broke above its late afternoon to early overnight session high of 1600.50 to 1602.75...
Disclosure: Long NQU09.

***remember this is an illustration of what i am trading and my thinking...my trading plan may change without notice...this is not a recommendation for you or anyone else, to buy or sell this or any other security...***

8/19/2009 post close update


  • NQ appears to have made a nice recovery from the -1.00% opening gap, closing up about 0.50%
  • the discretionary NQU09 swing trade is now essentially flat...
  • still looking to sell the NQU09 at 1607.50, 1617.50, 1627.50...the orders are on my brokers book, and could be hit overnight if the NQU09 trades up there...
  • if any of these orders are hit, i am not sure where and when i may re-enter the NQU09...
  • the 'BTD Index' systemic swing trade is up about 2%...an exit signal has not been generated for this model yet...if the NDX closes about 0.30% or more above today's close, then a 'BTD Index' exit signal will be generated for tomorrow's close...
  • no systemic swing trade entry signals were generated for today's close...
  • between yesterday and today, i remodeled six of my systemic swing trading models...in addition to the 30 models i am currently trading, there are about a half dozen that are on the suspension list...these will be remodeled as well...
  • this process takes a lot of time...i figure i can do about 3/day...with some focus and hard work, i should finish this by labor day...
  • did some daytrades this am (and yesterday am) in my vcm daytrading account...flat for the two days...
  • need to filter out more of the setups that get discussed in the vcm chat room (DOW, HPQ) and just enter the ones that make sense to me (NVDA...great trade idea from the room, but i scalped it instead of R it and left a lot on the table)...
  • my scalp trades tended to work out well (ERTS, ANN)...
  • my R based trades netted out flat (HURN + 1R, LANC -1R)...
  • very happy with how i entered, exited, position sized and managed the HURN trade...i should look to this trade as a model of how i should R trade...
  • in the IRA and custodial accounts, the FAS was flat today...exit orders are still on the book at the same levels mentioned in earlier posts...

Disclosure: Long NQU09, long FAS.


***remember this is an illustration of what i am trading and my thinking...my trading plan may change without notice...this is not a recommendation for you or anyone else, to buy or sell this or any other security...***

Tuesday, August 18, 2009

8/18/2009 pre open update


  • yesterday was the crusher: SB IDX got stopped out for its largest historical loss and the NQ discretionary swing trade had a big drawdown, and FAS got hit for about 10%...
  • the systemic swing trading portfolio is now down about 10% from its early july high...historically, the portfolio has experienced a max drawdown of about 15% from its recent high, so this current drawdown is within normal expectations...however, the max drawdown usually coincides with a big move down in the market, and since early july the market has not been moving down but rather has had a a big move up...perhaps extreme momentum in either direction is problematic for the systemic swing trading portfolio...
  • i am giving even more consideration to rebuilding all the models in the portfolio...the rebuilding will keep the basic structure/filters of each model, and just update each filter's parameter setting to reflect the additional in sample market data that each model would now include...
  • due to the way the leading indicators of economic growth are behaving (http://stbsmb.blogspot.com/2009/08/ecris-wli-growth-rate-runs-up-to-26.html) and in my belief that most money managers are under weighted equities, i believe the 'fear of missing' psychology will kick in and we will see a huge equity market runup into the end of the year...
  • i have been using a very small lot size for each addition to the discretionary NQU09 swing trade because of the possibility that the bottom of the range would break and we would push down to the mid or low 1500's...i only held the position because i believe this move up is not over, not over by a long shot!
  • i added another NQU09 lot (third) at 1576.00 yesterday...i am now averaged in at 1596.17...i am looking to sell the third lot at 1607.50, the second lot at 1617.50, and the first lot at 1627.50...maybe it will take a week or a month to get back to these levels, but this is my current plan..
  • i am also planning on adding more NQU09 if we go lower...however since we broke the bottom of the base that dates back to 7/23, and are now testing the bottom of the base that extends back to 7/22, i will be more discriminant with my future additions...
  • looking to add more FAS at 61.50...
Disclosure: Long NQU09, long FAS.

***remember this is an illustration of what i am trading and my thinking...my trading plan may change without notice...this is not a recommendation for you or anyone else, to buy or sell this or any other security...***

'BTD Index' generated an Entry Signal for Monday's Close, 8/17/2009.


'BTD Index' generated an Entry Signal for Monday's Close, 8/17/2009.

The last two trade's from this model turned out well, each one generating a new high for the Equity Curve.

Here are some of the model's Performance Statistics:

  • Model Tracking Vehicle=NDX
  • Start Date=11/1/1985
  • Number of Trades=121
  • Average Trade Return=1.68%
  • Average Winning Trade Return=2.71%
  • Average Losing Trade Return=-2.51%
  • Win Rate=80%
  • Ratio of Average Win/Average Loss (RAWAL)=1.08
  • Profit Factor=4.38
The Average Winning Trade is just a bit more than the Average Losing Trade, but this model generates 80% winners.

Disclosure: Long NQU09.

Disclosure: The performance results shown above are for Model analysis purposes and do not include commission or slippage. The model is built on data from the NDX, but I trade the model with the NQ e-mini. Actual trading results from the NQ usually differ from the model results of the NDX, with the NQ showing somewhat weaker performance data. Nonetheless, I still trade this model with the NQ and when executed according to the plan, it has generated consistent profitability for me.

***remember this is an illustration of what i am trading and my thinking...my trading plan may change without notice...this is not a recommendation for you or anyone else, to buy or sell this or any other security...***

'SB IDX' gets stopped out for its largest historical loss.


'SB IDX' gets stopped out for its largest historical loss.

The Modeled position (IDX) posted a 2.59% loss, which is worse than the average losing trade return of -0.62%. The actual Trading position (EMDU09) posted a 2.67% loss (including commissions), slightly worse than the model.

This was the largest single trade loss for the model. Is the model broken or just going through a rough patch? I don't think this question can be answered yet. Still the loss was ugly and disappointing for a model that has performed so well historically.

Monday, August 17, 2009

ECRI's WLI Growth rate runs up to a 26 year high.

Economic Cycle Research Institute's Weekly Leading Index (WLI) growth rate has run up to a 26 year high:

"...Meanwhile, the index's annualized growth rate leapt to a 26-year high of 13.4 percent from last week's five-year high of 10.4 percent, which ECRI originally reported at 10.5 percent.

It was the index's highest yearly growth rate reading since the week to Aug. 26, 1983, when it stood at 13.9 percent.

"With WLI growth surging, the odds are rising that the early stage of this economic recovery will be stronger than any since the early 1980s," said Lakshman Achuthan, Managing Director at ECRI.

Achuthan recently told Reuters that the national recovery would be stronger than many expect, though signs of such strong growth will not be apparent until sometime next year..."

http://www.businesscycle.com/news/press/1529/

http://www.businesscycle.com/

Friday, August 14, 2009

'SB IDX' generated a long entry signal for today's close, 8/14/2009.


'SB IDX' generated a long entry signal for today's close, 8/14/2009. It is due to be exited at Monday's Close unless its Money Management Stop is hit intraday.

The model is currently trading just below its all time high. This is the third entry for the model in the past 2 weeks. With a bit of luck, this one will be the charm. Today's late day rally continued past the 4pm close all the way to the 415 futures close. The lot I purchased at 4pm rallied +0.63% to the 415 close. I am hoping that this end of day strength will continue on Monday. Its been nearly 6 weeks since a decent size gain has been booked by the systemic swing trading portfolio.

Here are some of the model's Performance Statistics:
  • Model Tracking Vehicle=IDX
  • Start Date=7/1/1994
  • Number of Trades=50
  • Average Trade Return=0.41%
  • Average Winning Trade Return=0.77%
  • Average Losing Trade Return=-0.62%
  • Win Rate=74%
  • RAWAL (Ratio of Average Win/Average Loss)=1.25
  • Profit Factor=3.55

A strength of the model is the win rate of 74%. A weakness of the model is the Money Management Stop can be pretty high, currently 2.6%.

Disclosure: Long the EMDU09.

Disclosure: The performance results shown above are for Model analysis purposes and do not include commission or slippage. The model is built on data from the IDX, but I trade the model with the EMD e-mini. Actual trading results from the EMD usually differ from the model results of the IDX, with the EMD showing somewhat weaker performance data. Nonetheless, I still trade this model with the EMD and when executed according to the plan, it has generated consistent profitability for me.

***remember this is an illustration of what i am trading and my thinking...my trading plan may change without notice...this is not a recommendation for you or anyone else, to buy or sell this or any other security...***

8/14/2009 post close update


  • in my view the bulls are still in charge...the markets negative reaction to the lower than expected michigan consumer confidence, took us below 1600 on the NQ...however some mid afternoon nibbling by the longs led to what looks like a big squeeze of the shorts into the 4pm close, which then continued into the 415pm futures close...
  • i remain long the NQU09 at avg price of 1606.25/contract...it closed at 1615.50...the position is currently +9.25/contract unrealized...
  • i am still looking to sell the second lot at limit 1622.50, and the first lot at limit 1627.50
  • if these levels get hit, i will then determine at what levels i will look to re-enter the NQU09 discretionary swing trade...
  • FAS also showed late day strength, putting in a nice bottoming tail on its daily bar for the second day in a row...
  • 'SB IDX' generated an entry signal for today's close...i will post a separate entry for this later...
  • did some work testing the 'SB IDX' discretionary swing model on intraday time frames...nothing robust was found...
  • next week i will test the 'SB SPY' and the 'SB NDX' models on intraday time frames...
  • my fingers are crossed for JE as he starts trading his intraday ES model in realtime (http://myestradingjournal.blogspot.com/2009/08/off-hours-return-to-live-trading.html)

Disclosure: Long NQU09, long FAS.

***remember this is an illustration of what i am trading and my thinking...my trading plan may change without notice...this is not a recommendation for you or anyone else, to buy or sell this or any other security...***

Quiz: What personality trait may best predict achievement in the real world? Hint: it's not smarts.

Answer: According to the following article, the answer is not the standard measures of intelligence, but rather the ability to set a long term goal and work exceedingly hard toward it. In a word, its 'grit'.

**********************************************************************************************************************

The truth about grit

Modern science builds the case for an old-fashioned virtue - and uncovers new secrets to success.

by Jonah Lehrer

http://www.boston.com/bostonglobe/ideas/articles/2009/08/02/the_truth_about_grit/?page=1

**********************************************************************************************************************

Here are some quotes from the piece that I found to be very interesting:


"...The new focus on grit is part of a larger scientific attempt to study the personality traits that best predict achievement in the real world. While researchers have long focused on measurements of intelligence, such as the IQ test, as the crucial marker of future success, these scientists point out that most of the variation in individual achievement - what makes one person successful, while another might struggle - has nothing to do with being smart. Instead, it largely depends on personality traits such as grit and conscientiousness. It’s not that intelligence isn’t really important - Newton was clearly a genius - but that having a high IQ is not nearly enough..."
“...I’d bet that there isn’t a single highly successful person who hasn’t depended on grit,” says Angela Duckworth, a psychologist at the University of Pennsylvania who helped pioneer the study of grit. “Nobody is talented enough to not have to work hard, and that’s what grit allows you to do....”
"...Lewis Terman, the inventor of the Stanford-Binet IQ test, came to a similar conclusion. He spent decades following a large sample of “gifted” students, searching for evidence that his measurement of intelligence was linked to real world success. While the most accomplished men did have slightly higher scores, Terman also found that other traits, such as “perseverance,” were much more pertinent...”
“...Genius is 1 percent inspiration and 99 percent perspiration,” Thomas Edison famously remarked - the researchers are quick to point out that grit isn’t simply about the willingness to work hard. Instead, it’s about setting a specific long-term goal and doing whatever it takes until the goal has been reached. It’s always much easier to give up, but people with grit can keep going..."
"...One of the main obstacles for scientists trying to document the influence of personality traits on achievement was that the standard definition of traits - attributes such as conscientiousness and extroversion - was rather vague. Duckworth began wondering if more narrowly defined traits might prove to be more predictive. She began by focusing on aspects of conscientiousness that have to do with “long-term stamina,” such as maintaining a consistent set of interests, and downplayed aspects of the trait related to short-term self-control, such as staying on a diet. In other words, a gritty person might occasionally eat too much chocolate cake, but they won’t change careers every year. “Grit is very much about the big picture,” Duckworth says. “It’s about picking a specific goal off in the distant future and not swerving from it...”
The following finding from the study surprised me. As a parent, I have been praising my three year old son for the effort he puts into figuring out the the world around him and sticking to the task in front of him. Perhaps I should do it more.


"...In recent decades, the American educational system has had a single-minded focus on raising student test scores on everything from the IQ to the MCAS. The problem with this approach, researchers say, is that these academic scores are often of limited real world relevance.
However, the newfound importance of personality traits such as grit raises an obvious question: Can grit be learned?
While Duckworth and others are quick to point out that there is no secret recipe for increasing grit - “We’ve only started to study this, so it’s too soon to begin planning interventions,” she cautions - there’s a growing consensus on what successful interventions might look like.
Interestingly, it also appears that praising children for their intelligence can make them less likely to persist in the face of challenges, a crucial element of grit.
For much of the last decade, Dweck and her colleagues have tracked hundreds of fifth-graders in 12 different New York City schools. The children were randomly assigned to two groups, both of which took an age-appropriate version of the IQ test. After taking the test, one group was praised for their intelligence - “You must be smart at this,” the researcher said - while the other group was praised for their effort and told they “must have worked really hard.”
Dweck then gave the same fifth-graders another test. This test was designed to be extremely difficult - it was an intelligence test for eighth-graders - but Dweck wanted to see how they would respond to the challenge. The students who were initially praised for their effort worked hard at figuring out the puzzles. Kids praised for their smarts, on the other hand, quickly became discouraged. The final round of intelligence tests was the same difficulty level as the initial test. The students who had been praised for their effort raised their score, on average, by 30 percent. This result was even more impressive when compared to the students who had been praised for their intelligence: their scores on the final test dropped by nearly 20 percent. A big part of success, Dweck says, stems from our beliefs about what leads to success..."
We can test our own level of grit here: http://www.gritstudy.com/